Bridging the Virtual and Physical: Using Accurate TIM Properties in Thermal Simulation Software
Thermal simulation is a powerful tool for predicting product performance and optimizing designs before a prototype is built. However, the accuracy of these simulations hinges on the quality of the input data—especially for materials like TIMs, which represent a primary thermal resistance in the system.
Using overly simplistic values (e.g., only a bulk conductivity from a datasheet) can lead to simulations that are off by 10-20°C, rendering them useless. To effectively model a phase change pad in software like ANSYS or Siemens FloTHERM, you need more nuanced data:
Critical Inputs for Realistic Simulation:
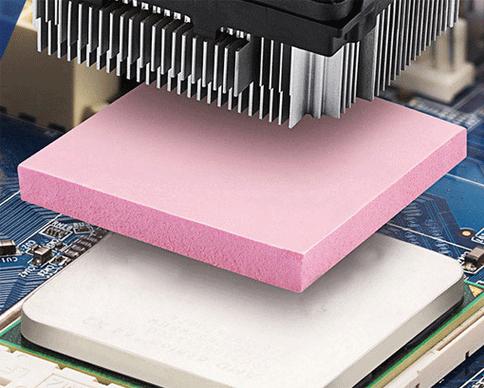
- Effective Thermal Conductivity vs. Pressure: The performance of a TIM changes with the clamping force applied. Request a graph from your supplier showing this relationship.
- Interfacial/Contact Resistance: This is often the dominant thermal barrier. Some advanced datasheets provide a total thermal resistance value (in °C-cm²/W), which is more accurate to use in simulations than conductivity alone.
- Thickness Under Compression: The final BLT (Bond Line Thickness) under design pressure should be used in your model.
The Virtuous Cycle: Simulate → Test → Correlate
The most advanced teams use a closed-loop process: they simulate with the supplier’s TIM data, build a prototype with that exact TIM, test it, and then correlate their thermal model with physical test results. This fine-tunes the model for incredible predictive accuracy in future designs.
Providing these simulation-grade material properties is part of our technical partnership. We equip your engineering team with the data needed to make your virtual prototypes reflect reality, reducing design cycles and physical testing costs.