Setting the Standard: How to Conduct a Fair and Effective TIM Performance Benchmark
Claims about thermal conductivity are meaningless without context. A fair benchmark requires controlling variables that dramatically affect results: pressure, surface finish, temperature, and measurement methodology. A poorly conducted test leads to incorrect selections and product failures. Here’s how to build a reliable benchmarking process.
The Pillars of a Reliable TIM Benchmark:
- The Test Fixture is Everything: You cannot replicate real-world performance by hand-tightening a heatsink. A proper fixture applies a calibrated, repeatable, and uniform pressure across the interface (e.g., 50 psi +/- 2 psi). This eliminates the single greatest source of error in DIY comparisons.
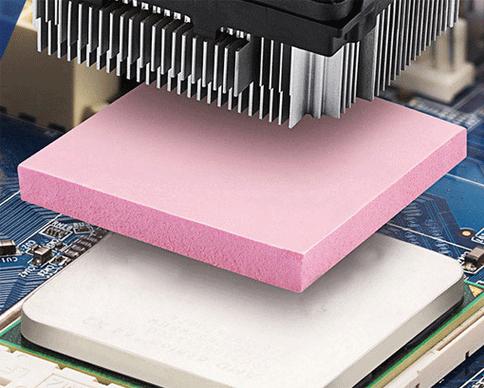
- Surface Preparation is Non-Negotiable: Test surfaces must have a consistent, documented roughness (Ra). Testing a soft pad on a mirror-finish lapped copper block versus a rough cast aluminum surface will yield wildly different results, skewing the comparison. Always prepare surfaces identically.
- Measure the Right Metric: Thermal Impedance: While vendors tout “W/m·K” (bulk conductivity), the most critical metric is thermal impedance (θ) in °C·cm²/W. This measures the total temperature drop across the TIM layer and its two contact interfaces under a specific pressure. It’s the real-world performance indicator.
- Follow a Recognized Standard: The industry reference is ASTM D5470, “Standard Test Method for Thermal Transmission Properties of Thermally Conductive Electrical Insulation Materials.” While a full implementation is lab-grade, its principles—controlled heat flux, defined boundary conditions, steady-state measurement—should guide your process.
Creating an Actionable Benchmark Report:
Your final report shouldn’t just list numbers. It should show performance curves: Thermal Impedance vs. Applied Pressure for each material. This reveals which TIM performs best under your assembly’s clamping force. It also shows if a material is overly pressure-sensitive—a critical design insight.
By adopting this disciplined approach, you move from guesswork to data-driven selection. We publish the SP180’s full thermal impedance curves under various pressures, not just a conductivity number, to provide the transparent, engineering-grade data required for a trustworthy benchmark.